.svg)


Data visualization in Vectorworks is a game changer for your BIM workflows! Learn how to implement it and transform how you approach design decisions in your BIM process.
What’s Data Visualization?
Data visualization turns data into knowledge, helping you make more informed decisions faster. It puts the data embedded in your objects into a visual, graphical context, applying it directly through your models and drawings. Just as your models help you conceptualize your project’s layout and design, data visualization lets you picture your “non-design” elements.
Data visualization gives you an aggregate, dynamic view that displays the graphical attributes of objects (color, fill, pen, etc.) based on various data, whether general or specific, according to function, object type, value or range of values, or any other attached record parameters that you specify. Think of it as a graphical or visual report.
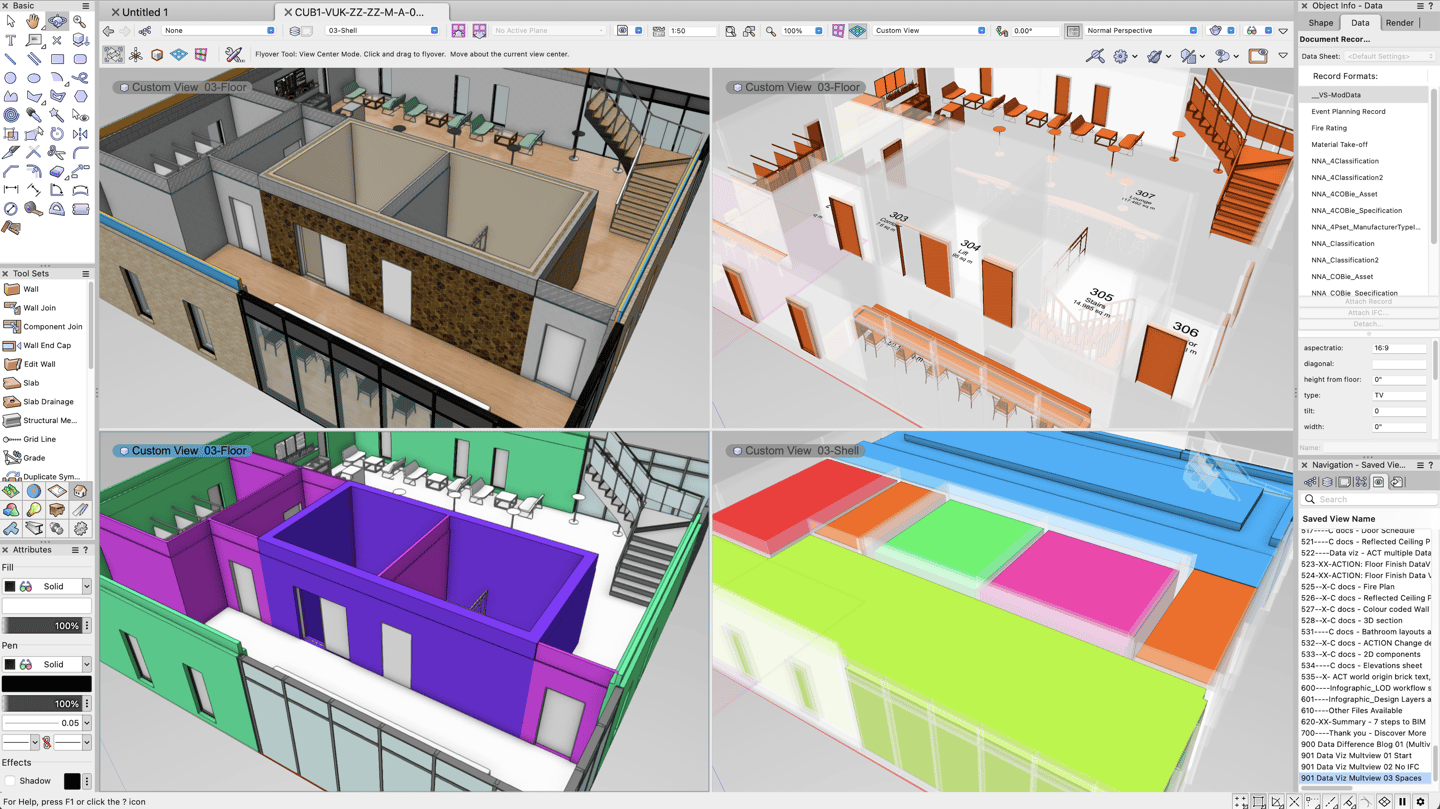
The same live BIM model and the data it contains can be presented in numerous ways simultaneously - and it can be used both within the design space during your design process AND on Sheets as a presentation tool.
Examples of data visualizations you can perform in your BIM models include:
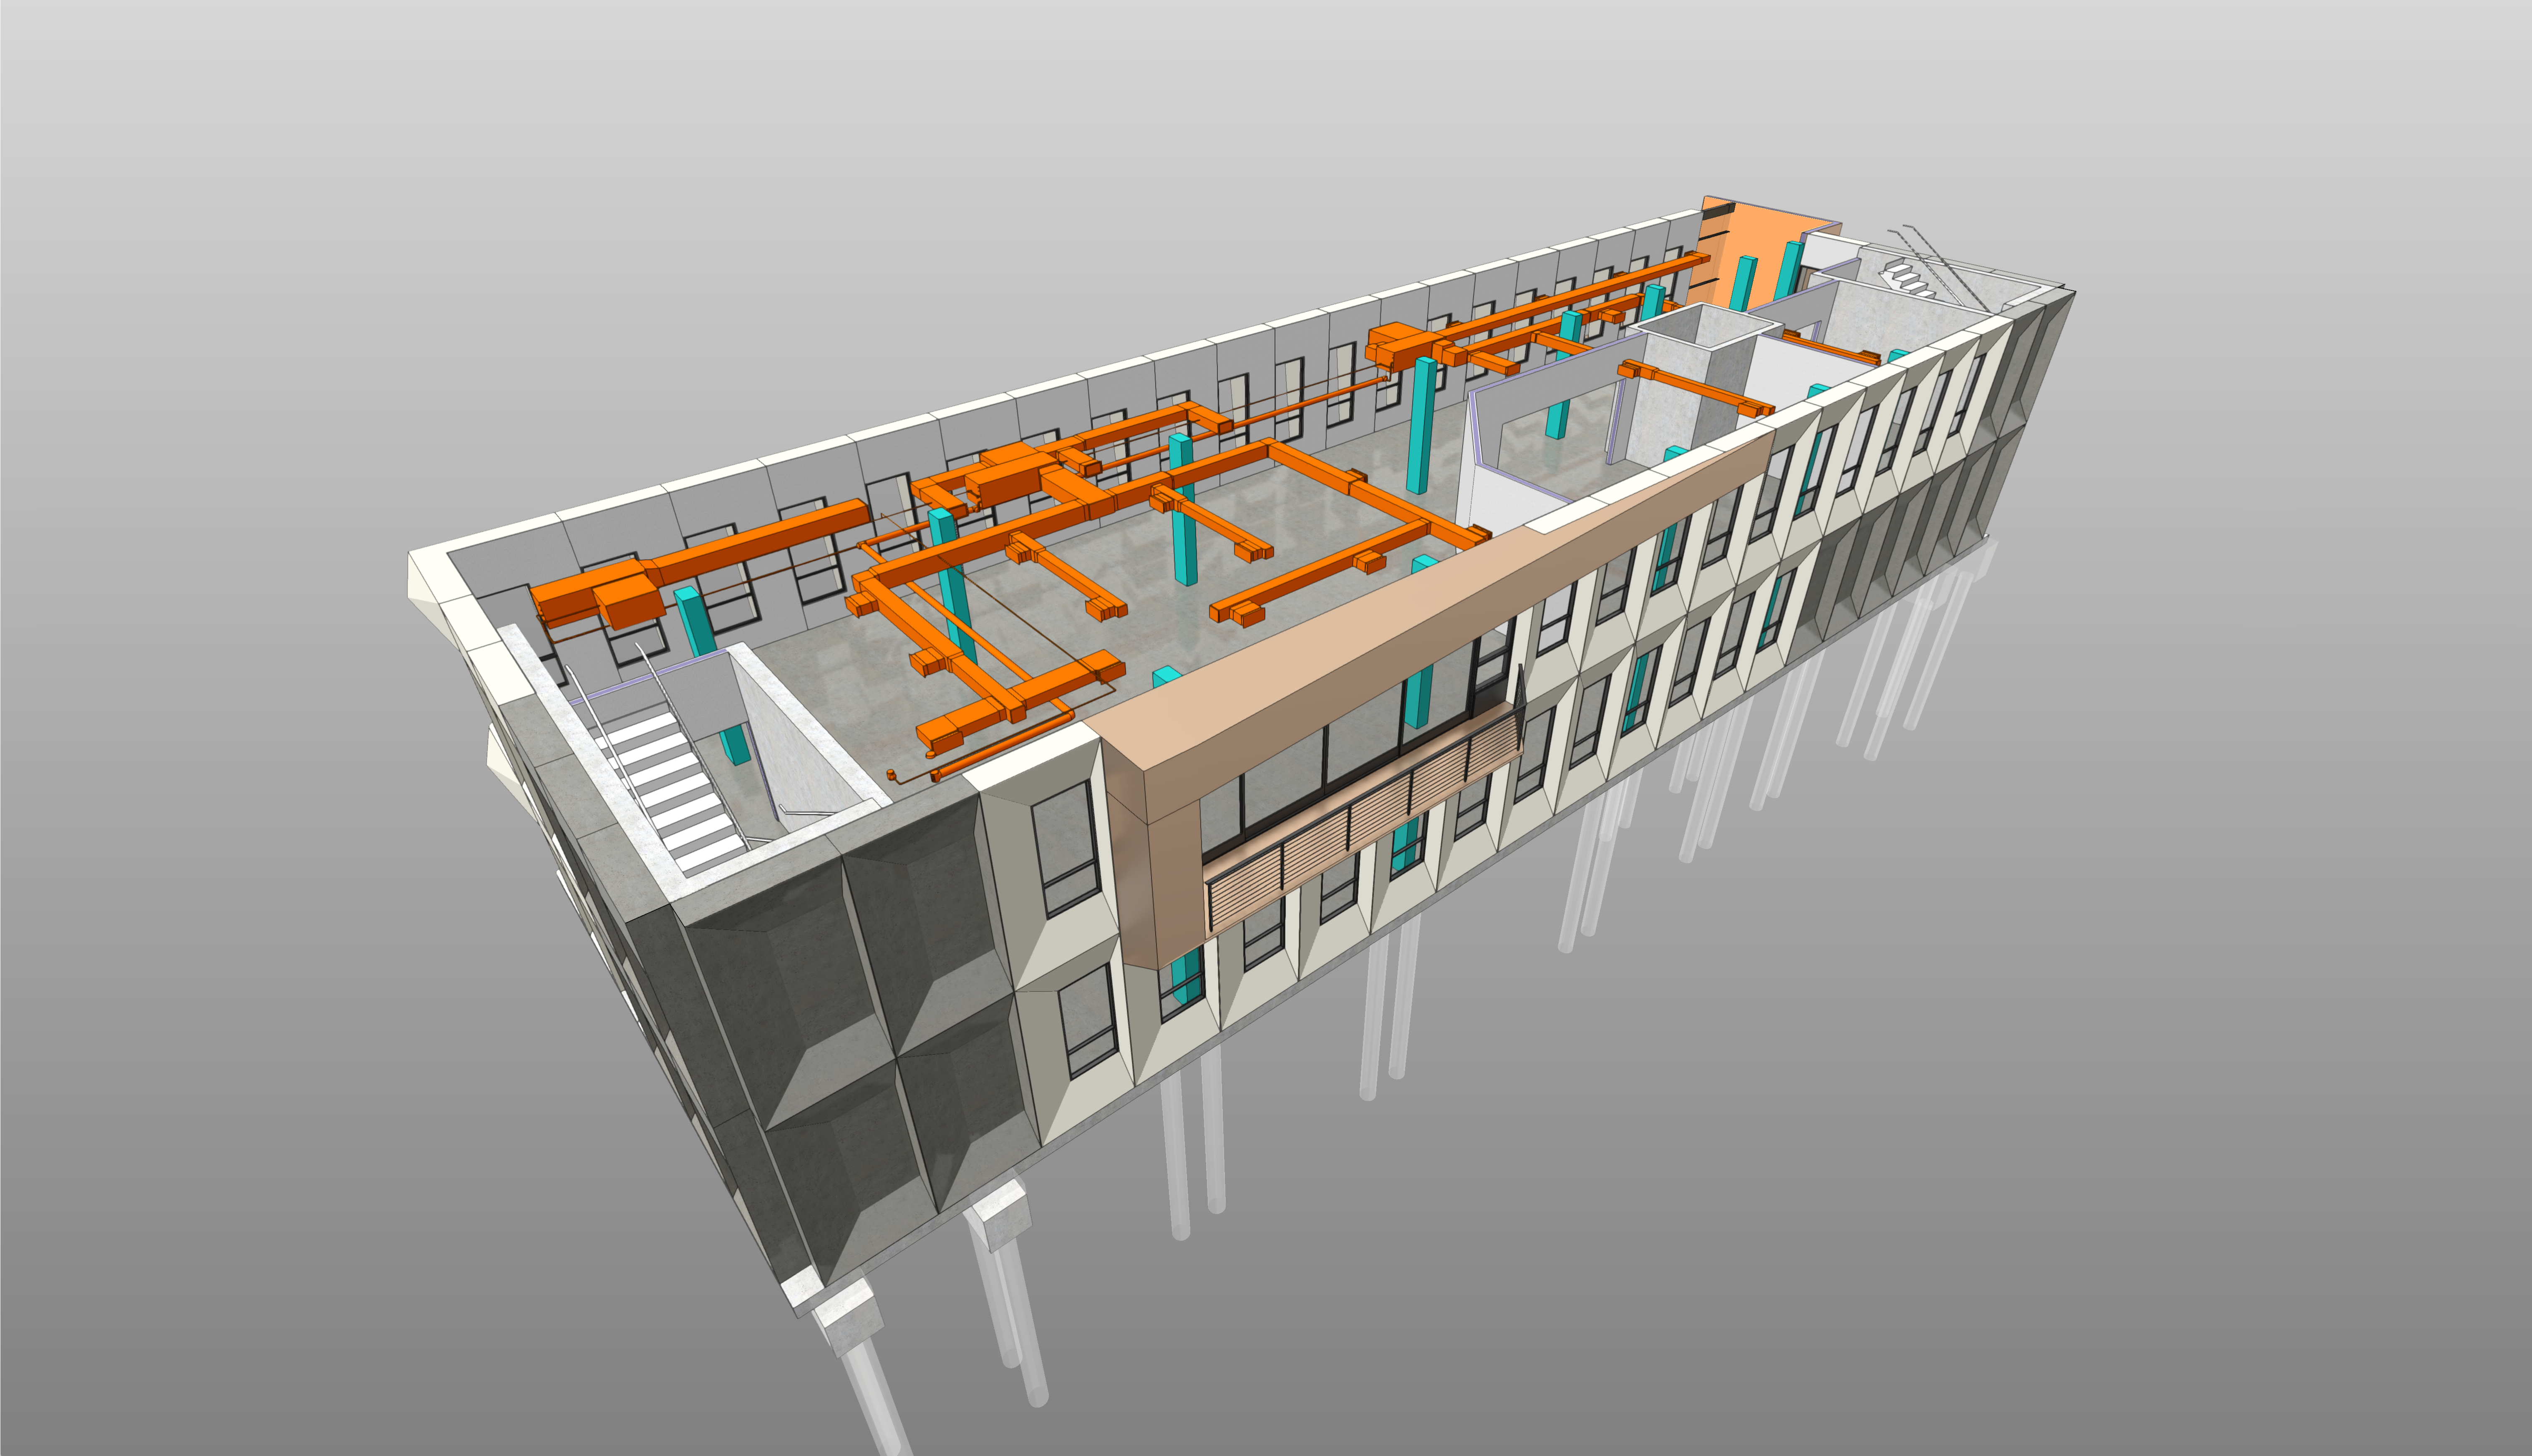
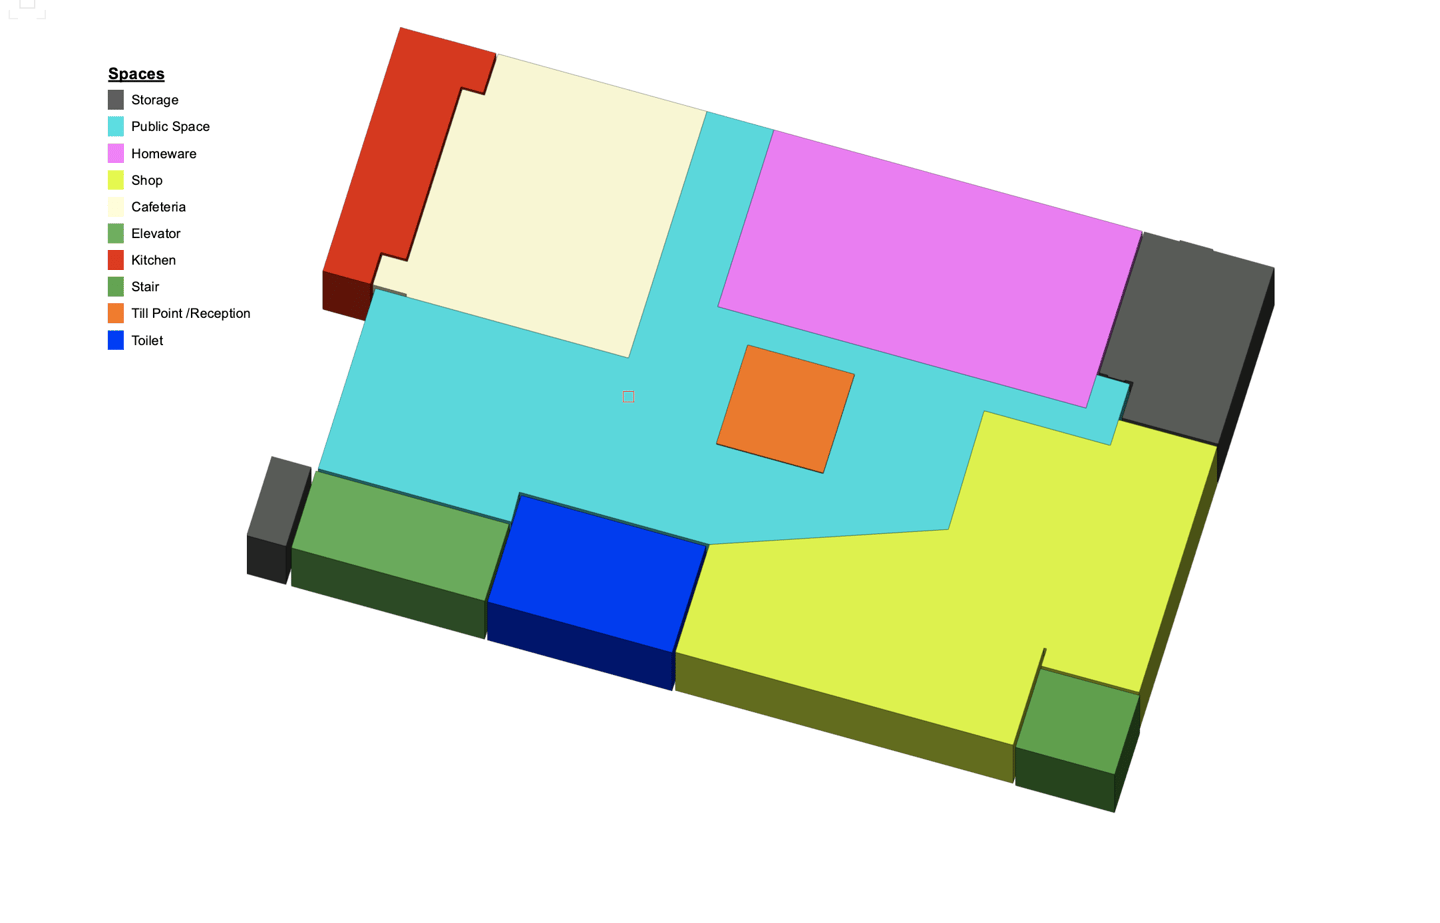
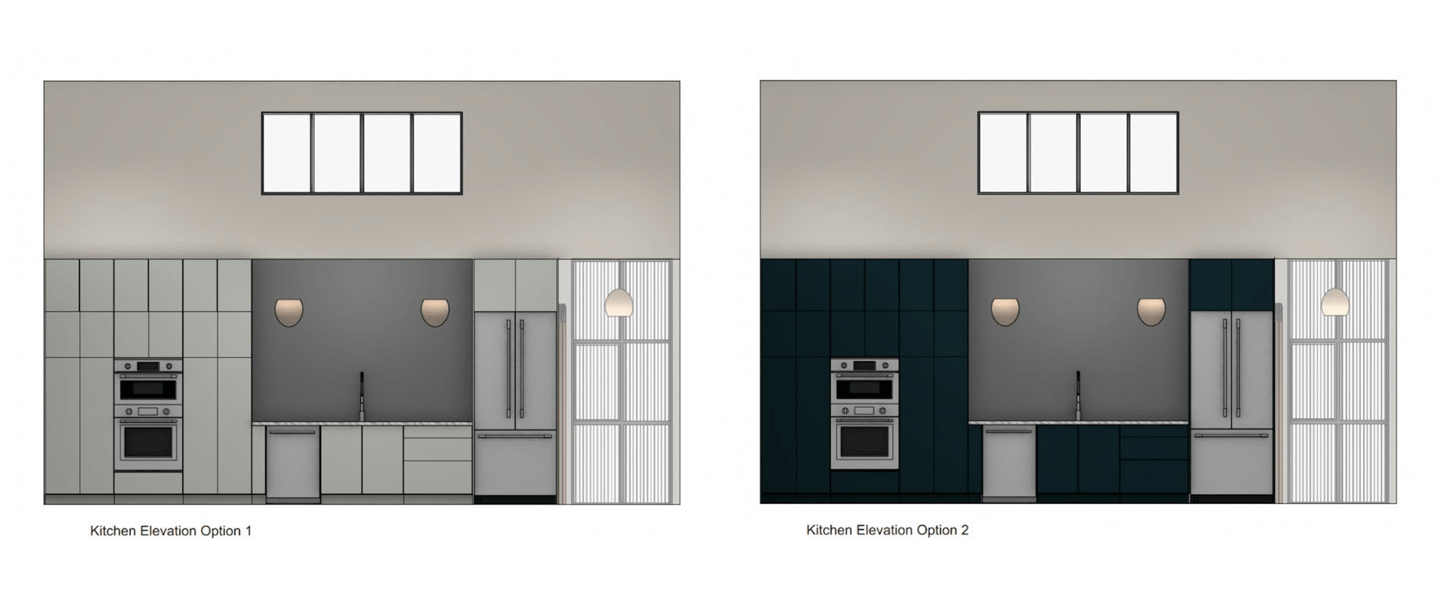
- Viewing space objects according to occupancy, usage, floor area, or any other record or parameter property. The examples below show both schematic and more illustrative render styles available.
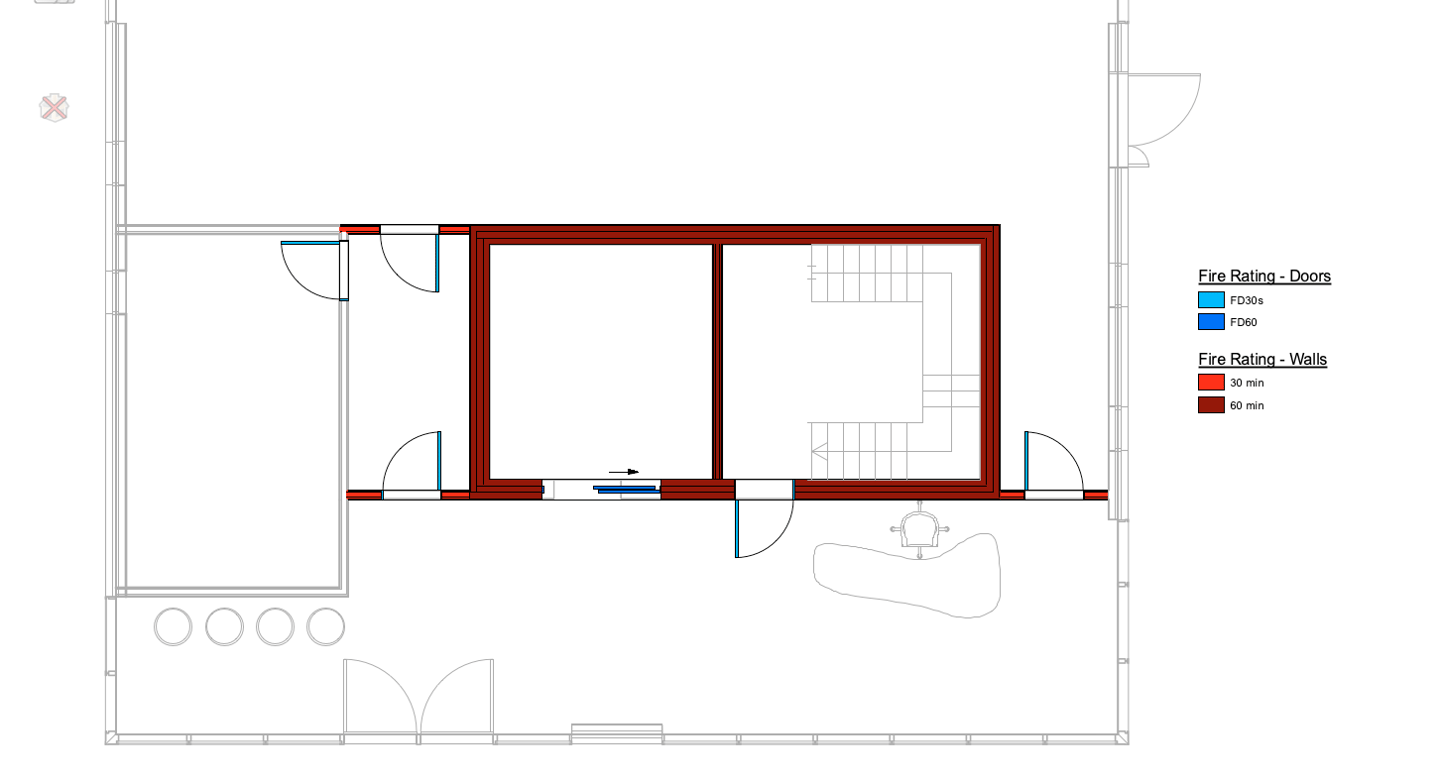
- Identifying materials in components and indicating values such as Fire Rating.
- Color coding objects by dimension, for example, walls according to wall height, to immediately locate any that aren’t at the correct height.

- Enhancing drawings with surface hatches based on materials or building element types. Or the overriding of textures to provide an alternate appearance or finish scheme when presenting a proposal to a client.
- Highlighting any custom elements which haven’t been assigned IFC data as well as identifying certain IFC types.
.png?width=1440&height=828&name=Image%206%20-%20To%20show%20custom%20elements%20(ORANJ%202).png)
What’re the Advantages of Data Visualization?
Save Time and Check Quality During Design Modifications
Data visualizations can be saved and applied to design layers and to viewports on a sheet layer. When a visualization is modified, your edits apply globally and instantly!
Additionally, a data visualization can be applied to perform quality checks to ensure that changes have been made correctly.
Real-Time Verifications
Since Data Visualization can easily be turned on from the View bar, it’s simple for you and your colleagues to display the drawing with either a data visualization or the object attributes.
Sophisticated Presentations at Your Fingertips
Multiple data visualizations can be selected for display at one time, meaning you can quickly create sophisticated presentations that used to take you hours or days to produce.
More Efficient Collaboration
In addition to being saved to a current file, data visualizations can also be saved in the user folder and a workgroup folder. This means that they can be used in other files and by other people in your organization.
Visual and Informative Reports
Worksheets have image functions that can apply a visualization to an object image by referring to a saved visualization or to a viewport’s applied visualization set.
How Do I Use Data Visualization in Vectorworks?
To create a new data visualization in Vectorworks, locate the Data Visualization menu. This menu is only available from the View bar when your design layer is the active layer. Or, you can create a data visualization from the Manage Data Visualizations dialog.
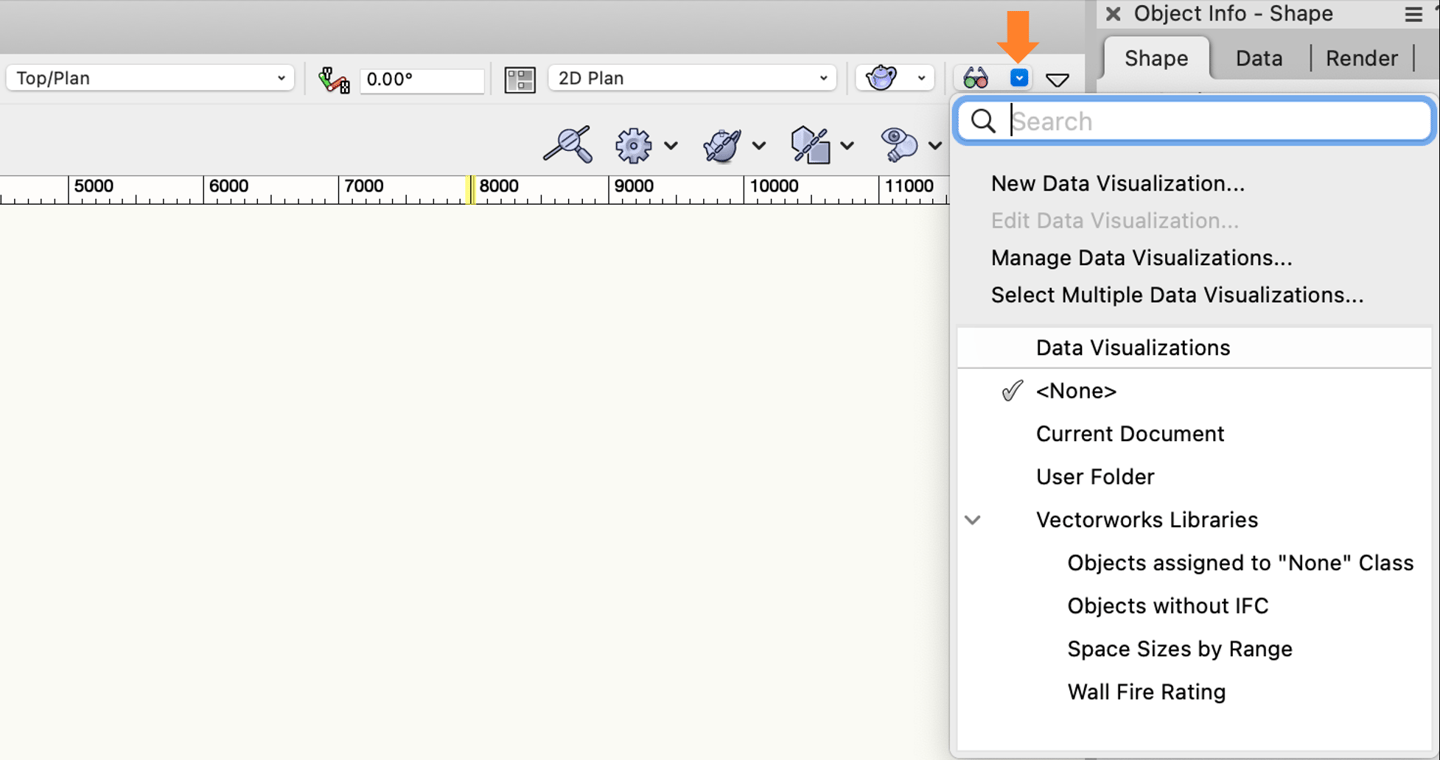
From there, follow these steps:
- Select New Data Visualization and provide a name for the data visualization.
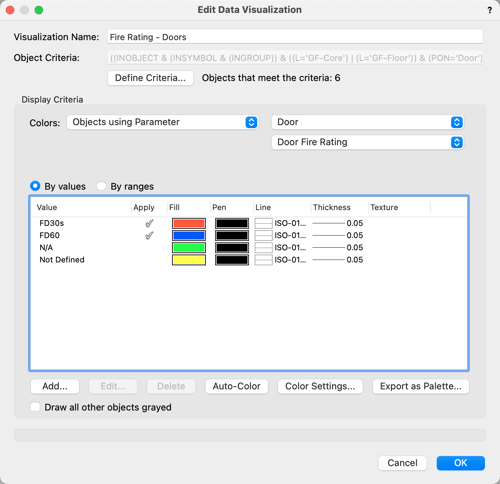
- Click Define Criteria to select the objects you want to include in your visualization, such as layers, objects, or textures.
- Once your object criteria are defined, select the display criteria from the Colors. This list determines the values or ranges of values to be differentiated by color or other visual attributes.
- The list of values or ranges will then be displayed. For numerical values, choose whether to apply the visualization by value (By values) or by numerical range (By ranges).
- To quickly assign a range of colors to the rows, click Auto-Color; this option automatically determines a different color for all items in the rows based on the selections for fill and/or pen in the Auto-Color Settings dialog.
- If setting attributes individually for row items, select one or more rows, and click Edit to specify the values and attributes. Make sure that Apply Attributes is checked in the upper left corner.
- You can also add rows of values or ranges by clicking Add and setting the parameters. To remove rows, select them and click Delete.
- Click OK to save the data. The name displays in the Data Visualization menu.
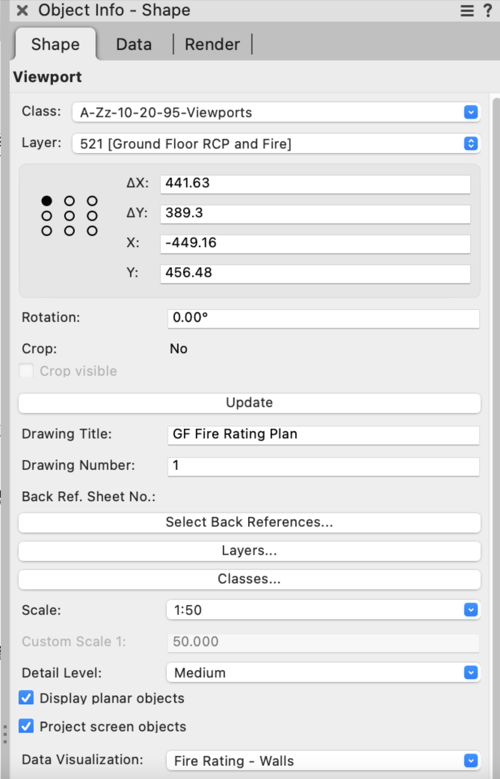
If you create a new data visualization from the Object Info palette of a selected viewport, it’s automatically applied to that viewport and any other selected viewports as well as in the Data Visualization menu.
How Can I Learn More About Vectorworks and the Data Difference?
To learn more about the data difference, check out our first story in the series, “The Data Difference | 3 Ways to Maximize Your Data Use for BIM.” The story covers the power of the Object Info palette, the Data Manager, and dynamic data assignment.
Click the button below to give it a read:

